This is the fifth in the (increasingly inaccurately planned) series of three posts exploring digital technologies and their potential use in heritage organisations and museums with limited funds but maximum enthusiasm.
In this post, we’re building on the use of 3D and adding Augmented Reality, thanks to a project which was a real treat to do.
The pins on the map below lead inquisitive participants to places around Widnes and Runcorn, as part of the Celebrating Halton’s Heritage project. The project is funded by the National Lottery Heritage Fund as part of Halton’s Borough of Culture 2021 celebrations.
Each pin links to a location, where an augmented reality experience awaits. In this article, we’re going to take a look at some of the technologies we used to construct it.
You can see map in original form on Lou Chapelle’s website, here. A renowned cross-disciplinary artist, Lou works in collaboration with people and communities to ‘create collective rituals and objects that question and re-invent our sense of belonging’. You can find out more about her work here.
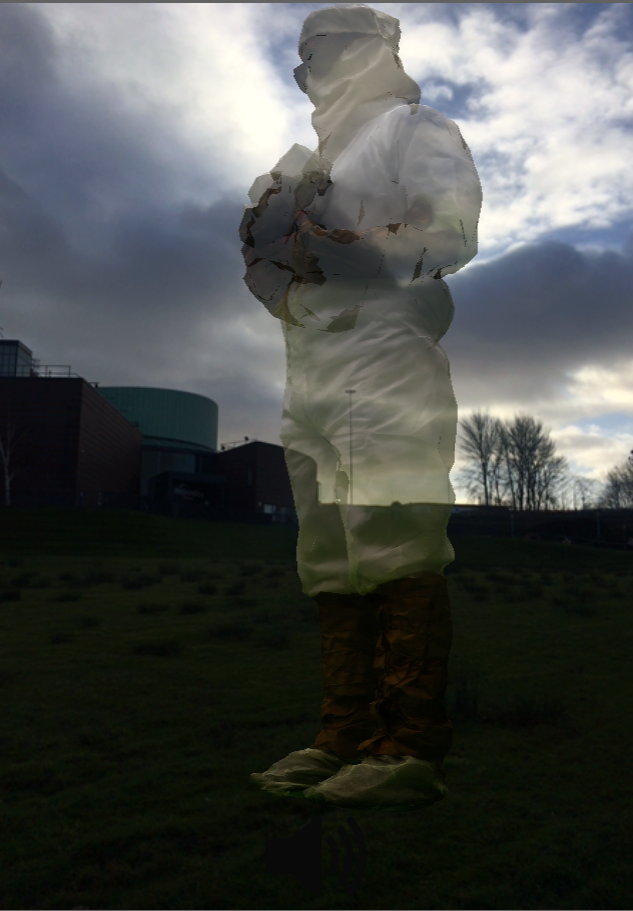
Lou is creative director for the part of the project which interprets the history and experience of the bleach packers – people who were employed in the local chemical industry to package product before shipping, a daily toil of quite breath-taking hardship.
What’s Augmented Reality?
It’s the technology which blends the real-world with one created digitally.
So, not a gimmick then?
Well – it’s come about from people exploring the limits of what mobile technology can do.
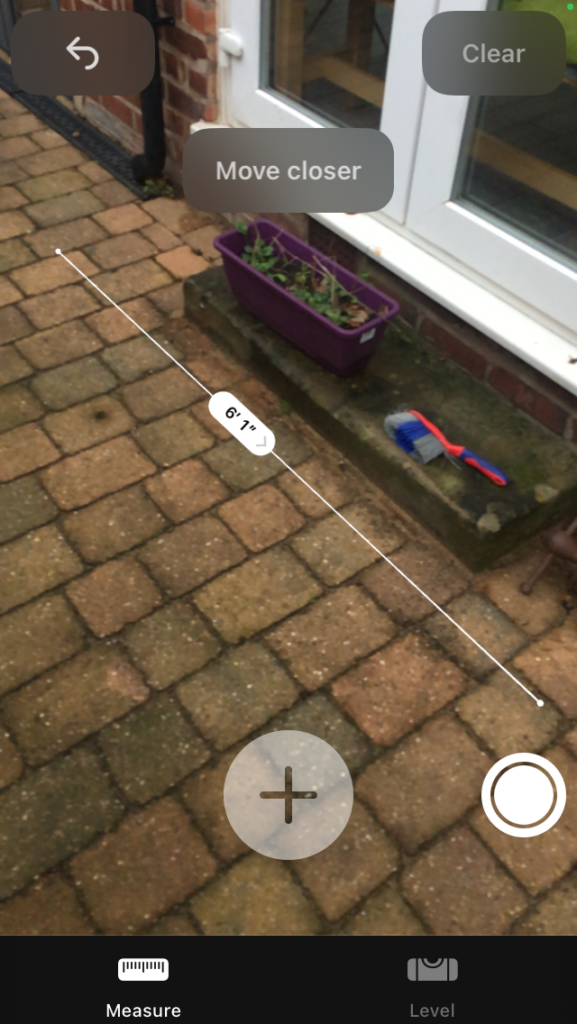
These days, you can find lots of apps on your mobile phone which use AR. If you own an iPhone, the ‘measure’ app is a classic example: you can use it like a kind of high-tech tape measure.
The app superimposes images over the top of your phone’s video feed to make it look as though they are placed in the real world, using its sensors to work out orientation.
Point to a location and move to another, and the app will draw a measurement line between them; amazingly these points hang around in virtual space, so that you can carry on measuring all around your room, and your original points are still there when you get back to them.
That looks pretty ho-hum.
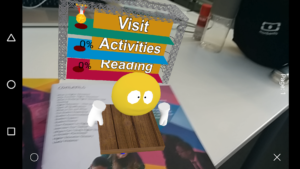
But it has utility. More impressive AR apps project full scenes, objects and animations, making millions of calculations per second. This screenshot from a previous project, shows an animated character popping out of an information booklet. It’s about higher education, for secondary school students. Vignettes like this add colour and subversive humour, increasing the booklet’s value and the likelihood of it sticking around its recipient until its precious resources could be useful.
And, for historical interpretation and museums?
AR is just one of the tools which can be used to add value to an historical interpretation, increasing novelty and engagement. Its intrinsic advantage is that no physical infrastructure needs building; it can be overlaid on existing objects. And while using their phone to access the AR, you can rest assured that your visitors aren’t being distracted in other ways by their devices…
The Proposal
So, to the project
Yes. Working with Lou and responding to her expression of Halton’s heritage. For authenticity’s sake, these are excerpts from the actual proposal:
Overview
Supply a static AR object embedded in a website, for outdoor viewing.
The AR object will be displayed using a static web application, downloaded to the smartphone’s browser. The static app will be hosted on a suitable free hosting service (TBD – Glitch or GitHub Pages). Visitors to the event will be able to scan a QR Code, using their smartphone’s camera.
Static 3D AR Model
A 3D AR model will be constructed, using a photogrammetric 3D body-scan of a human model, wearing a costume. The AR Model will be exported as a glTF file, and uploaded to the hosting site, above.
AR Coding
A small website will be constructed, using the libraries AFrame and AR.js. The website will be tested on the standard browsers for iPhone 6s running iOS 14 and Google Pixel 3a running Android 11.
Locations
The AR display will show the AR Model at the following locations:
Widnes:
- Cronton College
- Spike Island
- Widnes Market
Runcorn
- The Brindley
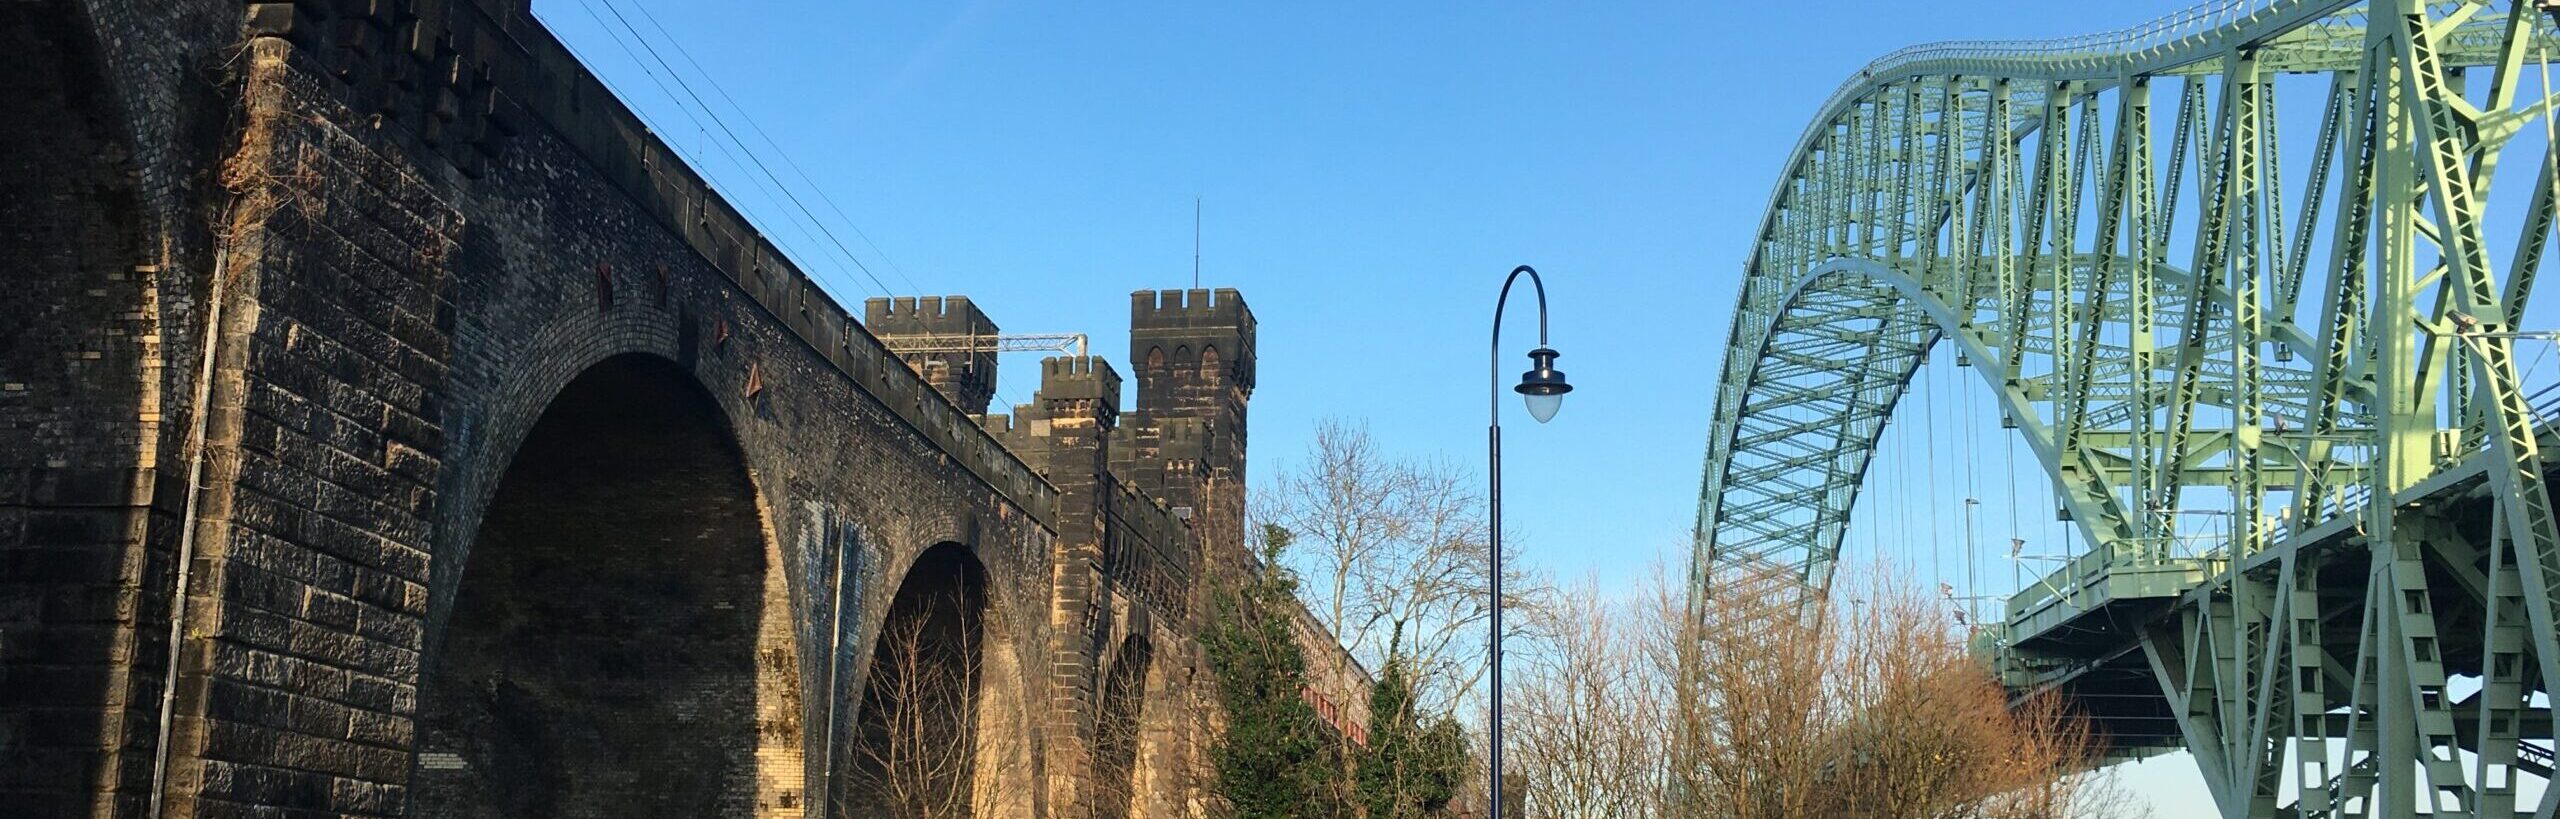
- Runcorn bridges
- Retail Park, Runcorn Shopping city
Activities
The following activities will be necessary to produce the above deliverable components:
- Coding of AR display website
- Photogrammetric Scanning
- Model construction
- Model optimising, positioning and lighting
- Geographical Positioning
What happened…?
We put together 4 amazing technologies which allowed us to fulfil the proposal with no costs other than labour and no ongoing infrastructure costs, either:
One of the big attractions to this project was the use of web, instead of native technologies.
Web Applications
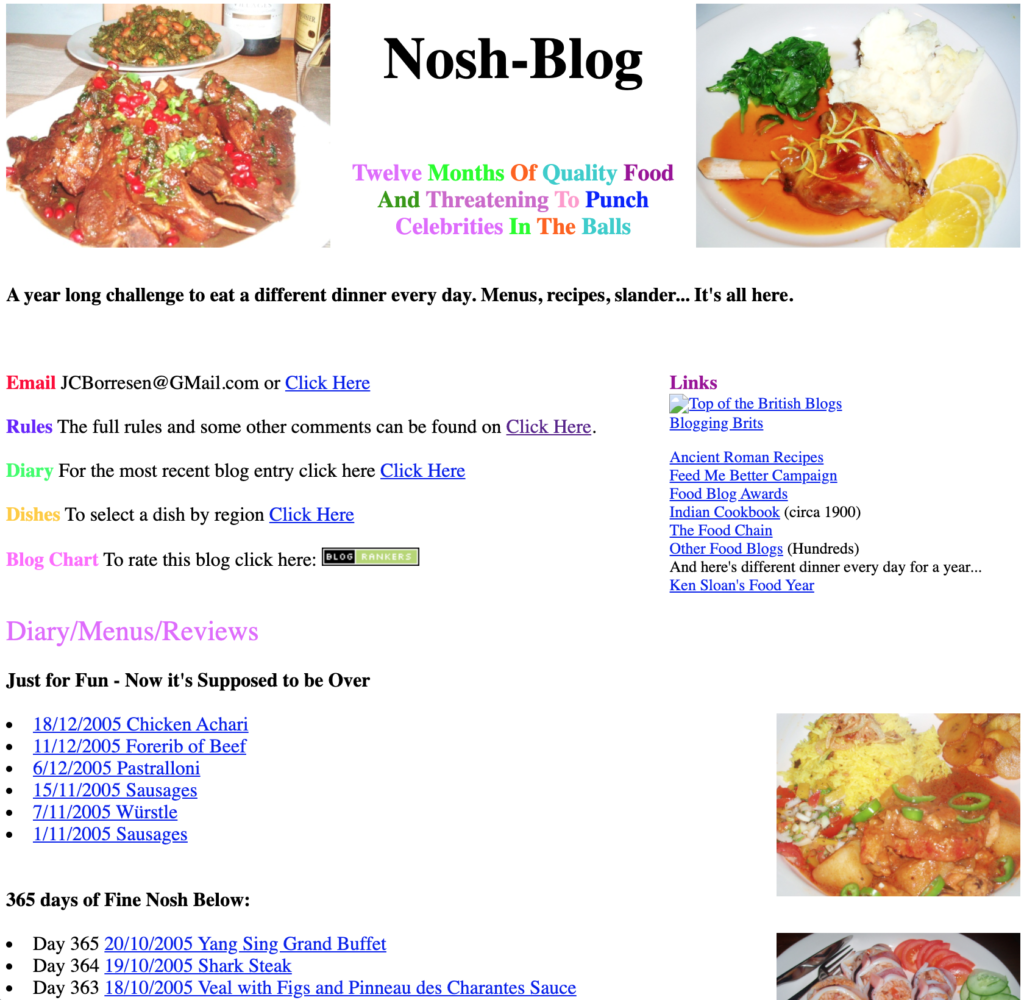
Tap picture to go.
How about some history?
The World Wide Web started off with three ground breaking technologies, in 1994, Thanks to Tim Berners-Lee:
- HTML, which provided a way to write web pages, like this
- the browser, an application which showed the pages
- HTTP, the communications protocol between browser and server – the computer on which the pages are stored.
These technologies used the infrastructure and low-level protocols provided by the Internet.
CSS, a way of adding style and colours, came soon afterward, as people wanted to get creative with their pages and make them look more artistic. This desire for novelty sparked huge competition between the tech companies providing browser technologies. Things got very out of hand, while everyone experimented on desktop computers with browser plugins like Adobe Flash.
Up until 2007, mobile phones played second fiddle to all this happening on the desktop. They got their own set of crumpled technologies called WAP. Limited by battery life, computing grunt and data transmission speed, it wasn’t until the advent of smartphones and specifically the arrival of the iPhone that mobile internet got any sort of real consumer demand.
We have to thank the iPhone and Google’s G1 for popularising the mobile internet. And Steve Jobs for refusing to have anything to do with Adobe Flash. If not for the stance he took, the uptake of the revamped HTML5 standard, with its integrated scripting language, Javascript, might have been delayed for quite some time.
And that, exhausted reader, gave us web applications.
So, whats’s a Web Application?
When you download a webpage these days, chances are you’re using one. A single-page web application is a chunk of HTML, a chunk of CSS, some pictures, icons and other resources and a program built using Javascript, to tell it all what to do. It has no need to go and get more webpages, but can use other web services to supply it with data – and more of that, later.
The genius in all this is W3C, the World Wide Web Consortium, who help to define and standardise the capabilities of the browser and the rest of the WWW, on which it plays.
Browser-based 3D Graphics

Browsers are getting pretty mighty
That’s right. Back in 2012, all the cutting-edge cleverness used to produce AR was packed into high-performance code, accessible on your mobile only by applications from the App stores. The idea that, one day in the distant future, we would be able to present it in the browser was worthy of mirth and this smug software engineer provided their fair share of guffaws at the aspirational souls who dared speak it.
Just 10 years later and I’m eating my words. I am very sorry. But oh, so very pleased!
AR from the browser?
Yes – it is actually possible to to present decent AR from a web application. The advantages are numerous, but biggest is that displaying an AR is now as easy as clicking on a link. There’s no messing about with going to app-stores and downloading huge files. That’s Friction, a term used to – well, describe how frustrating it is to use what we have made. Too much friction and our visitor gives up, before they’ve seen what we have to show them.
But new stuff is risky, right?
Yep. How do we know this technology is ready for us to use easily? It’s really important for small projects like this that we don’t say we can present some impressive new feature when halfway through, we find it’s only half baked.
That’s happened before, hasn’t it?
The great thing about the browser is that it is supplied as part of a smartphone’s software. Manufacturers have a vested interest to be cautious about what new capabilities they put in, and so they won’t risk their users getting cheesed off with something that doesn’t behave.
We know that if a new feature is going to be added, then it’s going to work.
So how do you know when a technology is available?
We just have to make sure that ALL the browsers on ALL the phones we are targeting had the feature we are going to use. That’s where standards definitions come in. We look them up so we can tell what browsers support them. When a technology is ripe for us to use, all browsers support its standard.
So AR is ready?
Yes. The AR experience our visitor can now seamlessly access is a web application, programmed in Javascript, utilising libraries built for 3D graphics and running in a browser accessing all the sensors and cameras your phone has to offer.
By the way, the ‘resources’ I mentioned above now include 3D models in a standard glFT format as well as pictures, video and sound, which leads me onto the next thing to talk about…
Photogrammetry
You’ve done that already. It was easy.
OK – Have a look at number 4 in this series to see how we got on with the photogrammetry of artefacts. We’re going a couple of steps further here, and using almost the same method to make a 3D model of a human.
This is a much bigger deal.
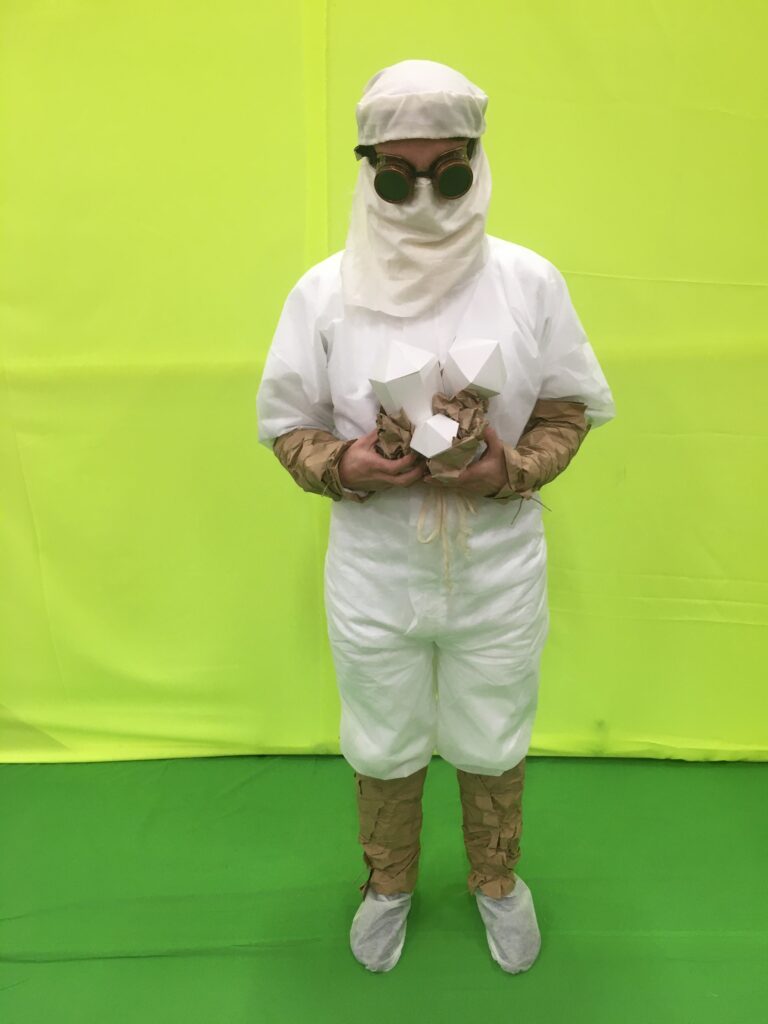
Thanks to Grangeway Community Centre, we were able to use their huge hall to erect a green screen.
It wasn’t the best; although we had enough bright fabric, the semi-shiny coveralls Lou was wearing reflected the green a little too much – so we had to use the darker colour on the floor.
Our intention was to take around 250 photos around Lou, using an iPhone, while she stood extremely still.
The process took around 10 minutes, and should have given the photogrammetry software enough to work on.
Alas, it wasn’t the case?
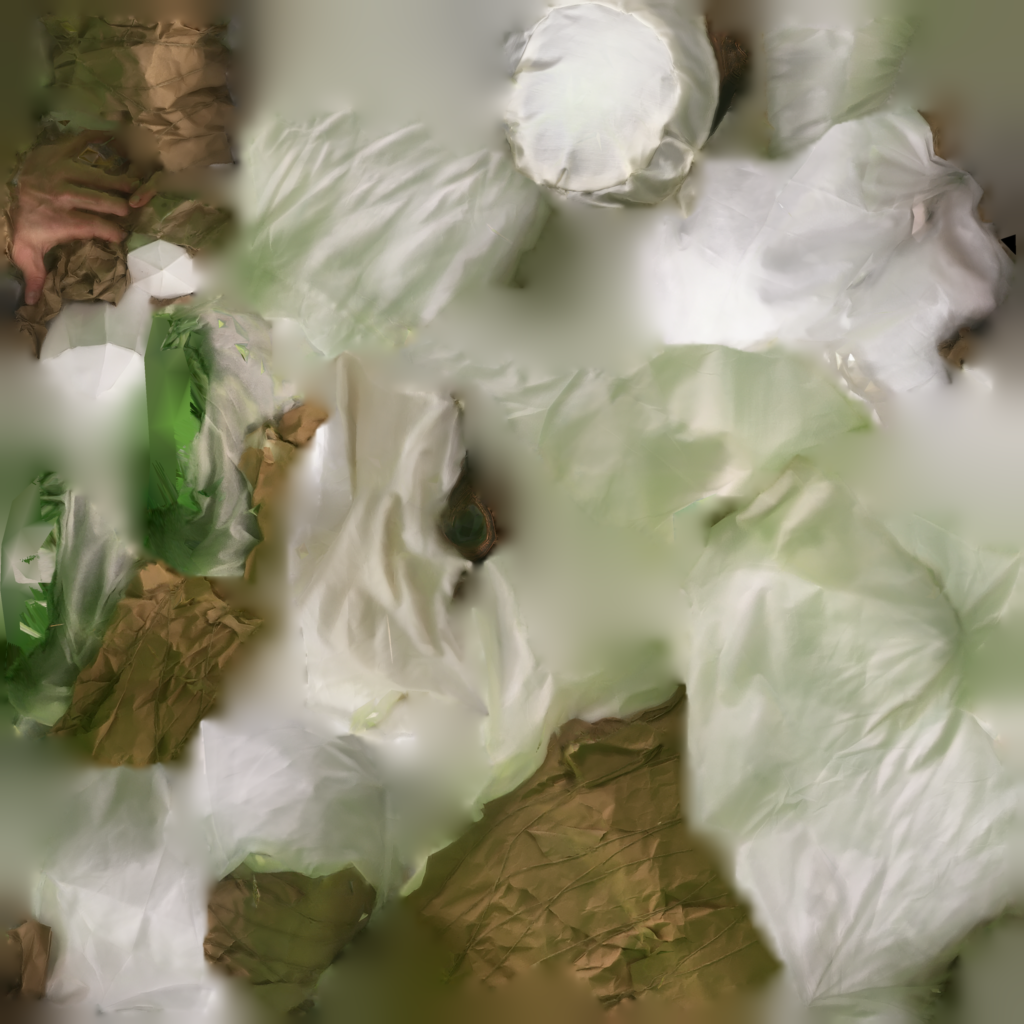
True. The beautiful sharp crystal she is holding became mushy in the model.
We gave the software a helping hand, by using a technique called masking, giving the photogrammetry software only the parts of the image we needed it to ‘see’. The green screen was essential here. We used another technique from film making called chroma-keying. Pixels of a certain colour (the green screen) are turned transparent, the final step being to swap transparent for black, and anything else for white, to create the mask.
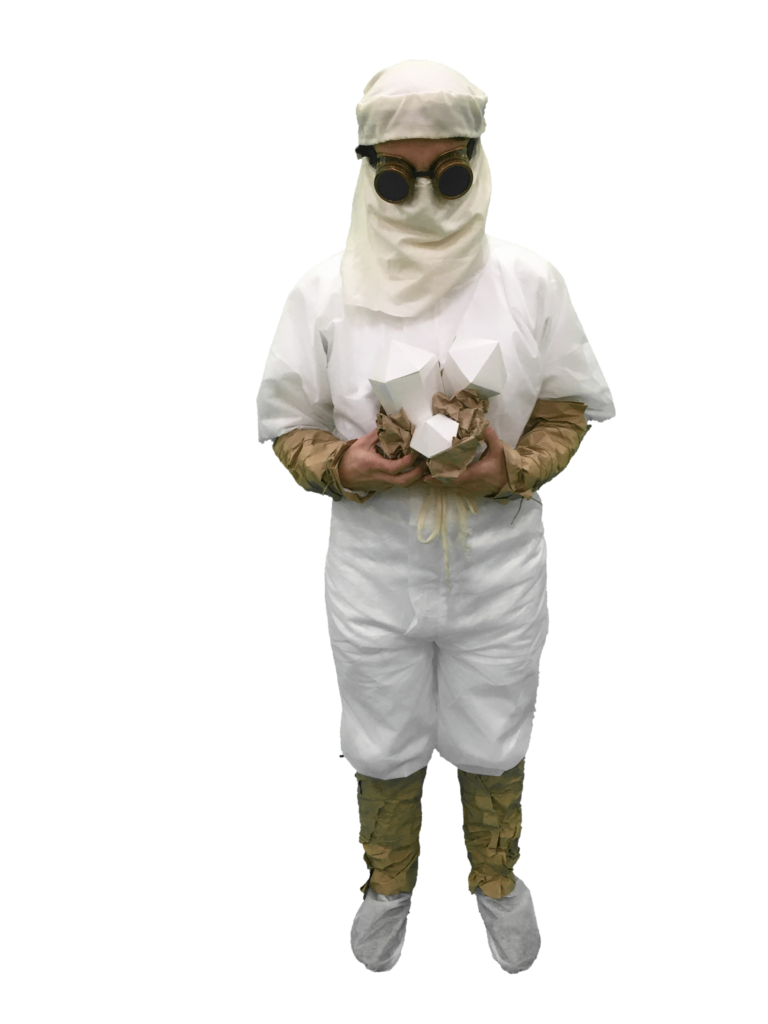

There are other ways of doing this other than chroma-keying; we also investigated the new advances in AI (Artificial Intelligence) where a neural network is trained to recognise the bits of an image which are human. You can guess the result. It didn’t work too well. Lou didn’t look human any more. Which says something, in a sad, historical sort of a way. Anyway, 250 masks later, things were much better:
We were really pleased with how it came out; the quality is fantastic.
So, on to the next bit!
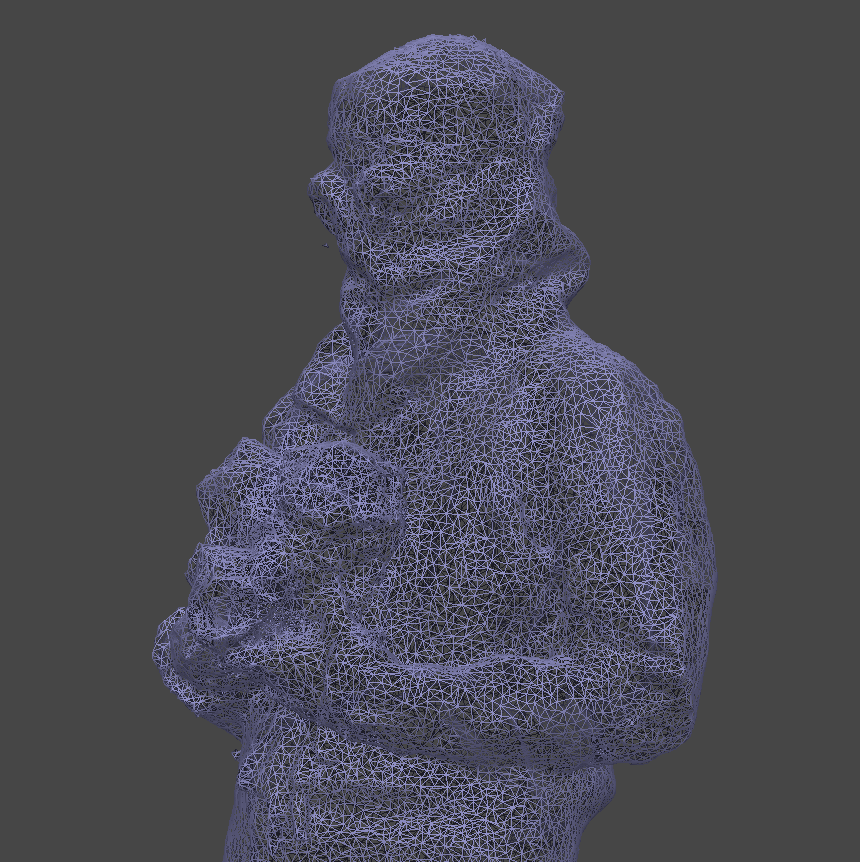
Not quite: The file size is too big. At 50MB we can’t expect it to download very quickly on a mobile device – especially outside where the signal can be a bit low.
A model is represented by thousands of tiny triangles, woven together in a mesh. Making the triangles bigger means you need less of them to make the model and the file size is smaller. The compromise is that the model is less detailed. This is called decimating.
Models also have a texture; it’s a bit like the Christmas paper around a gift. It supplies all the colours needed for a realistic wrapper. The texture is a .png image file, built by the photogrammetry software from all of the original camera images. Textures can be very high quality too. This can add to the download size, and also the amount of memory needed by the mobile web browser to render the model.
Reducing the size (resolution) of the image really helps.
The model size is now a much healthier 11MB.
Platforms-as-a-service
OK, we’re on the home straight, now.
Yep. We’ve got the model and the technologies. Now we’ve got to get them out there to a barely suspecting public.
There are two platforms-as-a-service to look at. The first is GitHub Pages, which we’ve used before.
GitHub Pages has made this project possible, by providing the platform to store, protect and distribute the code which creates web applications. And for small-fry like us, it’s free. It’s your first look at a Platform-as-a-Service.
On the web, services abound, providing functions we rely on.
Sounds nebulous.
It all has a purpose. Now you know a bit more about web applications, we can go a bit further with an acronym: JAM. Stands for Javascript, APIs and Markup, or HTML5, plus data from other servers. Web applications that get their data from other servers (or web services) are JAM.
That’s where that other acronym comes in: API. That’s Application Programming Interface. It means anything where a client (web application) makes a request (to a service), and gets some data. The boundary between the client and the service is the interface. It’s normally some sort of communications protocol. Helpfully, the one which everyone uses now is the same protocol used to get web-pages; good old HTTP.
Here’s a commercial API for you to look at. It’s a service where you can request a postcode with a geographical location, or vice versa: People often know their postcode but would be hard-pushed to give their latitude and longitude. This service provides it.
Wait. So there are people out there waiting for me to ask them where I am?
Yes. Web services provide all sorts of information, from weather reports to air pollution and stock market fluctuations.
Here’s an example we cooked up in another existence: thanks, as usual, to Dave Mee, Athul Philip and Tevon McCrae for their sterling work with this demo. Want to see its API in action? Go here. Want to go really in depth? Try here.
We’re going to tie all this together now and look at Google App Engine
Hold onto your hats.
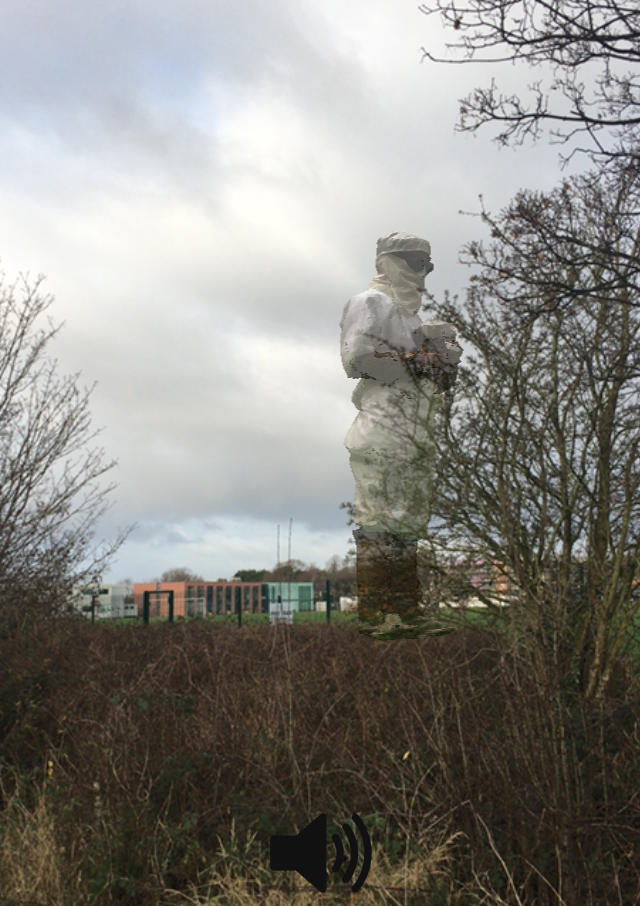
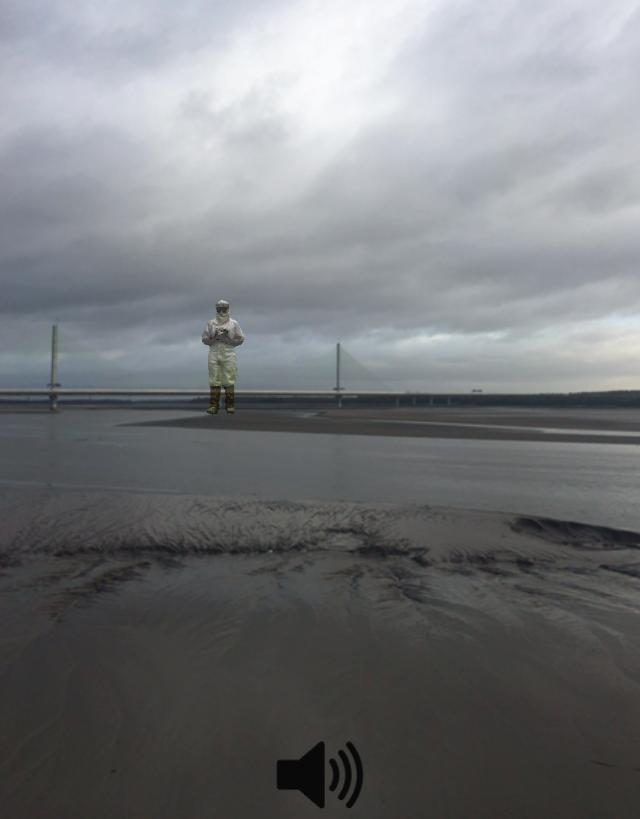
There are 6 (7, counting the one we added in the Mersey) locations for our project, each one displaying our wonderful model in AR.
Does this mean 6 little AR web apps?
No. Have a look at the URL (Acronym: Stands for Uniform Resource Locator. Means ‘web address’) for the AR we placed in the Mersey (viewable from the shoreline, obviously):
https://rescuestationcic.github.io/BleachPackers/?simulate=true&dist=3.66&bearing=180&lat=53.36233131724786&lon=-2.726872296717025&alt_m=0&height_m=2&period_s=10&opacity=0.6&model_height_m=1.6&c_x=0&c_y=0&c_z=0&c_rx=0&c_ry=0&c_rz=0We’ve added parameters to specify location, transparency, size and speed of rotation.
When the web application starts up in the browser, it reads these parameters from the browser, so it can present the model accordingly.
Ah. One web application, many parameters.
But that’s not the good part.
The good part is how Google’s enormous Platform / Software / Infrastructure-as-a-Service helped us tour around getting all the locations and presentation parameters right, by trial and error.
You did this manually? Not in your little office?
I get the plumb jobs. So, here are the locations, and the AR:
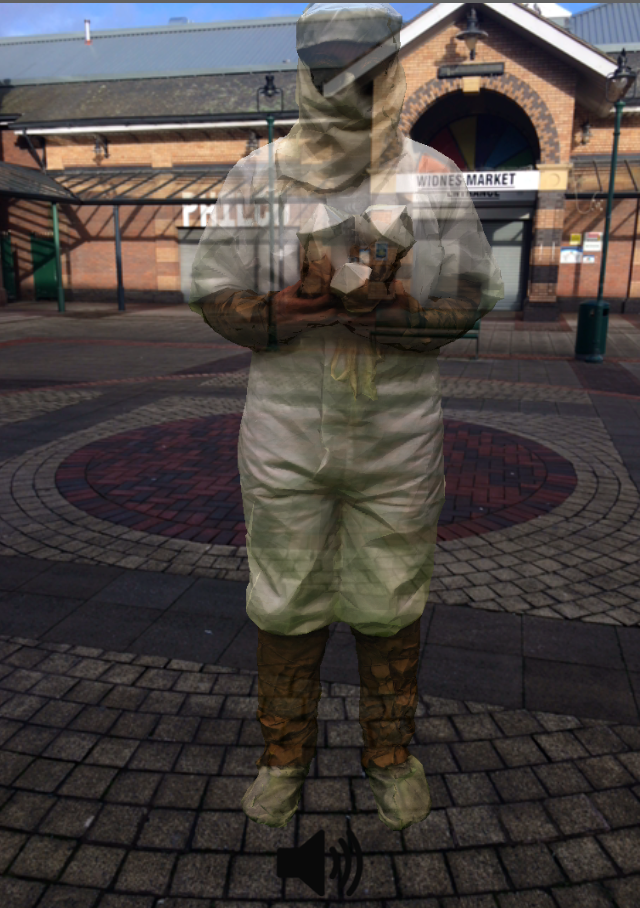
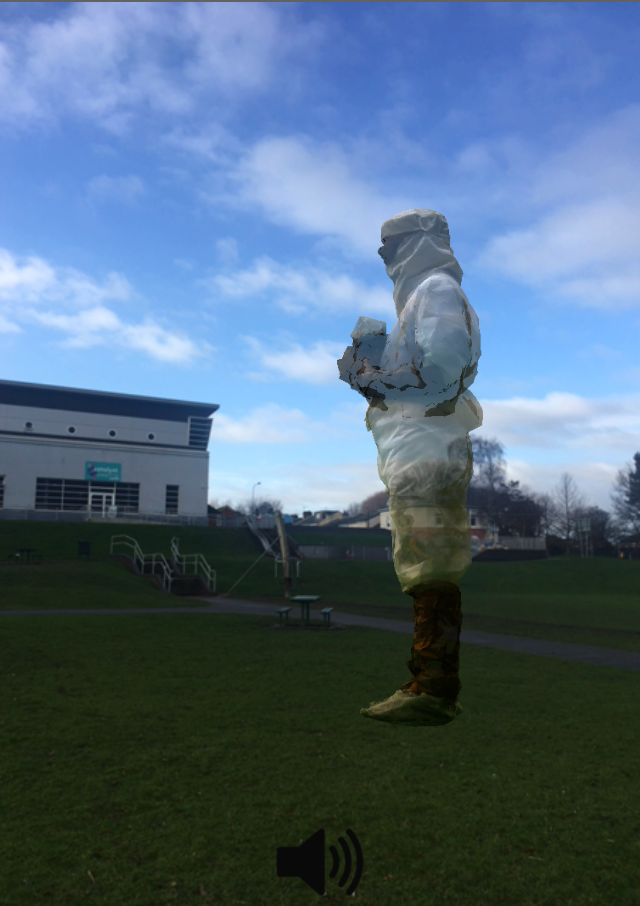
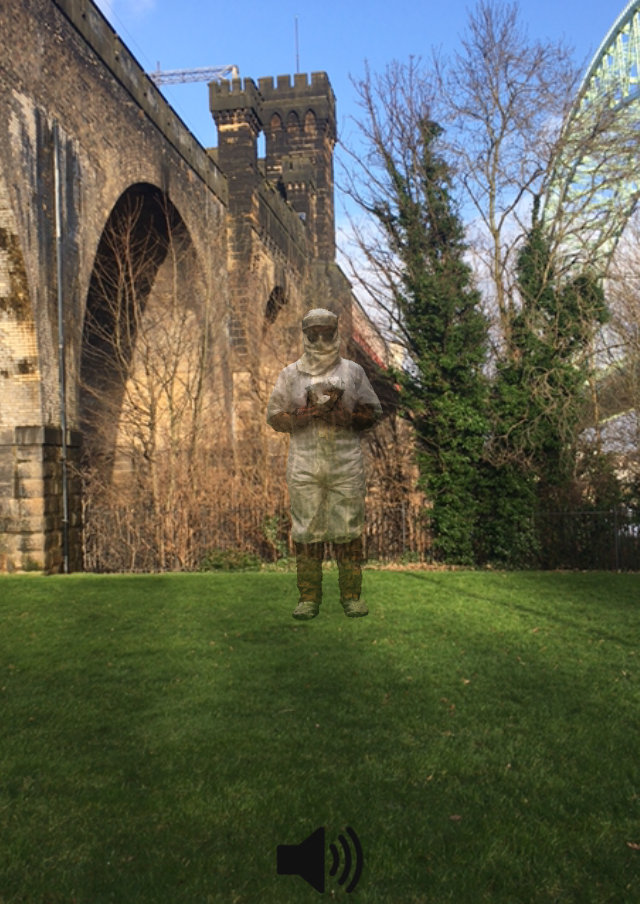
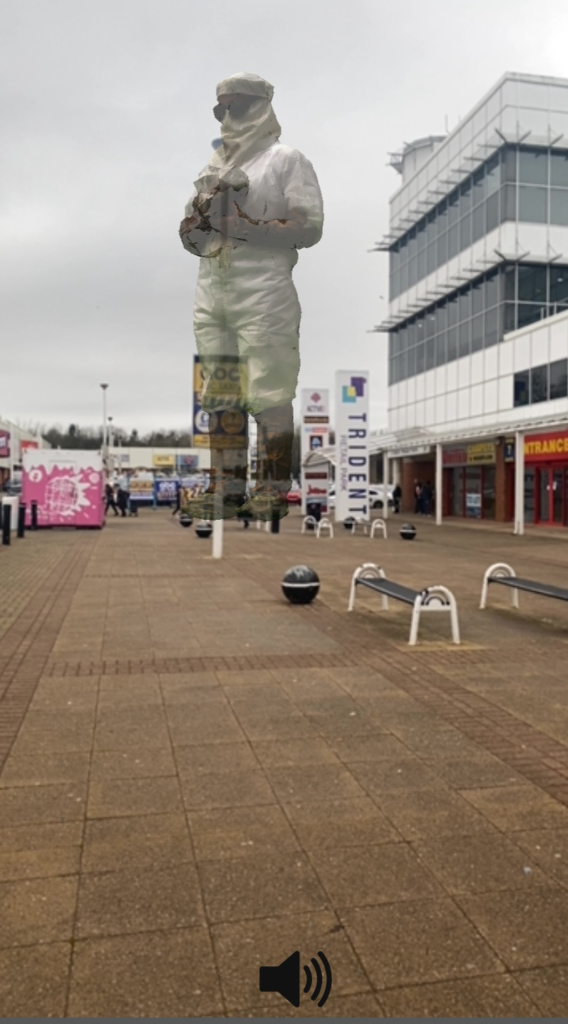
Each required some on-location jiggery-pokery, as we figured out what parameters would show the model in its best light.
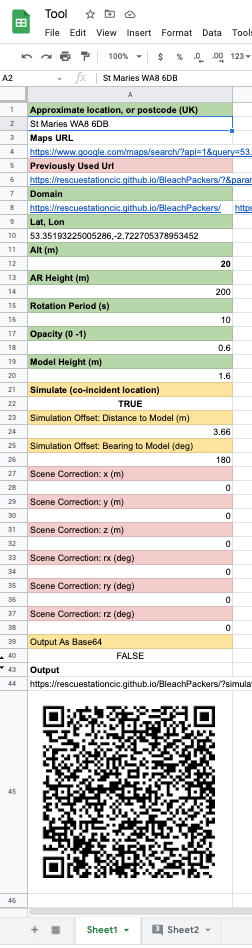
Enter Google Sheets (A spreadsheet application) , a laptop and a phone.
- Enter the name of the place we want have our AR.
- Google looks it up, using it’s Geoplacing API (the same one used by Google Maps.
- It displays a URL. We click on the URL to reveal the place on google map.
- We right-click on the precise location where we want the AR.
- Google obligingly copies the lat and lon geospatial coordinates to the clip-board.
- We return to the sheet, and paste in the value.
- We set up the ‘look’ of the model, using its parameters
- The sheet collates the parameters and creates a new URL.
- It uses another API at image-charts.com to convert the URL into a QR code.
- We point the phone at the QR code, which loads the Web App and and point the phone to where the AR should be, to see if we got it right.
- We give the parameters a tweak if needed, and try again.
- 10 or 20 tweaks at a location. Gone in 60 seconds. (slight exaggeration).
- Bearing in mind it’s freezing, and in the middle of winter, the effort making this tool was worth it.
This is all thanks to Google’s Software-as-a-Service, which allows access to a stunning piece of spreadsheet software, and a state-of-the-art scripting engine, coupled with its ability to connect to other services, all running on the World Wide Web. Free.
Take-aways?
- This has been a lovely short project, working with some really engaging people. Thanks all!
- The 3D model was created with a funny offset (they are meant to be centred at the origin of their own frame of reference) which I couldn’t find a way of resolving with the photogrammetry software (trial version). It meant that the easy ride I thought I was going to get coding with the Aframe and AR libraries evaporated, and I was forced to go to a lower level using the underlying three.js libraries, which took a few days to get into. That said, it did mean that I was able to see far greater potential. What’s next? Maybe some animation again!
- There were lots of small problems which took some Googling to figure out – for example: half the model going black when rendered on the Safari browser. Turns out I just needed to reduce the texture size. But not exactly a brain-stretch, there; the technology has been around long enough now that my little path is very well trodden, by a very kindly community who leave -er- breadcrumbs.
- I neglected to mention above my use of Jekyll and its Jekyll Maps plugin to provide the iframe-able map and pins. It was my first use of the GitHub Actions feature to do a Jekyll build using a non-whitelisted plugin. It was utterly seamless. Again; all free technologies.
This was the (extra added bonus) fifth post in the series of three – for more time-sink opportunities, look no further than:
Digital for Museums and Heritage 1: 360 Tours
Digital for Museums and Heritage 2: Infotainment